Earlier this month, I was the curator of @WeAreRLadies for a week. They have a different person tweeting every seven days; I was in charge in the week commencing 5th October.
When I was planning, I wondered how active I should be. I decided to do some analysis of the account to see if there was a normal pattern I could seek to replicate. To do this, I used the package rtweet to pull in tweets from the account for the past year.
With the get_timelines() function, you specify the account name and the number of tweets you want. I found through trial and error that I needed to pull ~2000 tweets to go back a year; I then filtered the data to make sure it only included tweets from the period I was interested in.
I took a few more steps to add information that would help me explore. Firstly I added a column to indicate if the tweet was a reply to another account or a retweet, to differentiate between those activities and original tweets directly broadcast on the channel. I also added a column to indicate the date of the Monday in that week so the analysis would pick up the different curator periods.
Throughout, I used data.table as it’s my preferred package for working with tabular data.
library(rtweet)
library(data.table)

# Download 2000 tweets from account
rladies_tweets <- as.data.table(get_timelines("WeAreRLadies", n = 2000))

# Filter so all tweets are between given dates
rladies_tweets <- rladies_tweets[created_at > "2019-10-07" &
                                   created_at < "2020-10-05"]

# Add a column to indicate tweet is not reply or retweet
rladies_tweets[, not_reply_retweet := (is_retweet == FALSE) &
                 (reply_to_screen_name == "WeAreRLadies"|is.na(reply_to_screen_name))]

# Add a column to group weeks by start date
rladies_tweets[, week_start := cut(created_at, "week")]

# Reduce down to relevant columns
rladies_tweets <- rladies_tweets[, .(created_at, text, favorite_count,
                                     retweet_count, quote_count, reply_count,
                                     not_reply_retweet, week_start)]
Using ggplot2, I plotted activity over time. You can do this through rtweet too but I found it easier to use ggplot2 once I’d transformed the data.
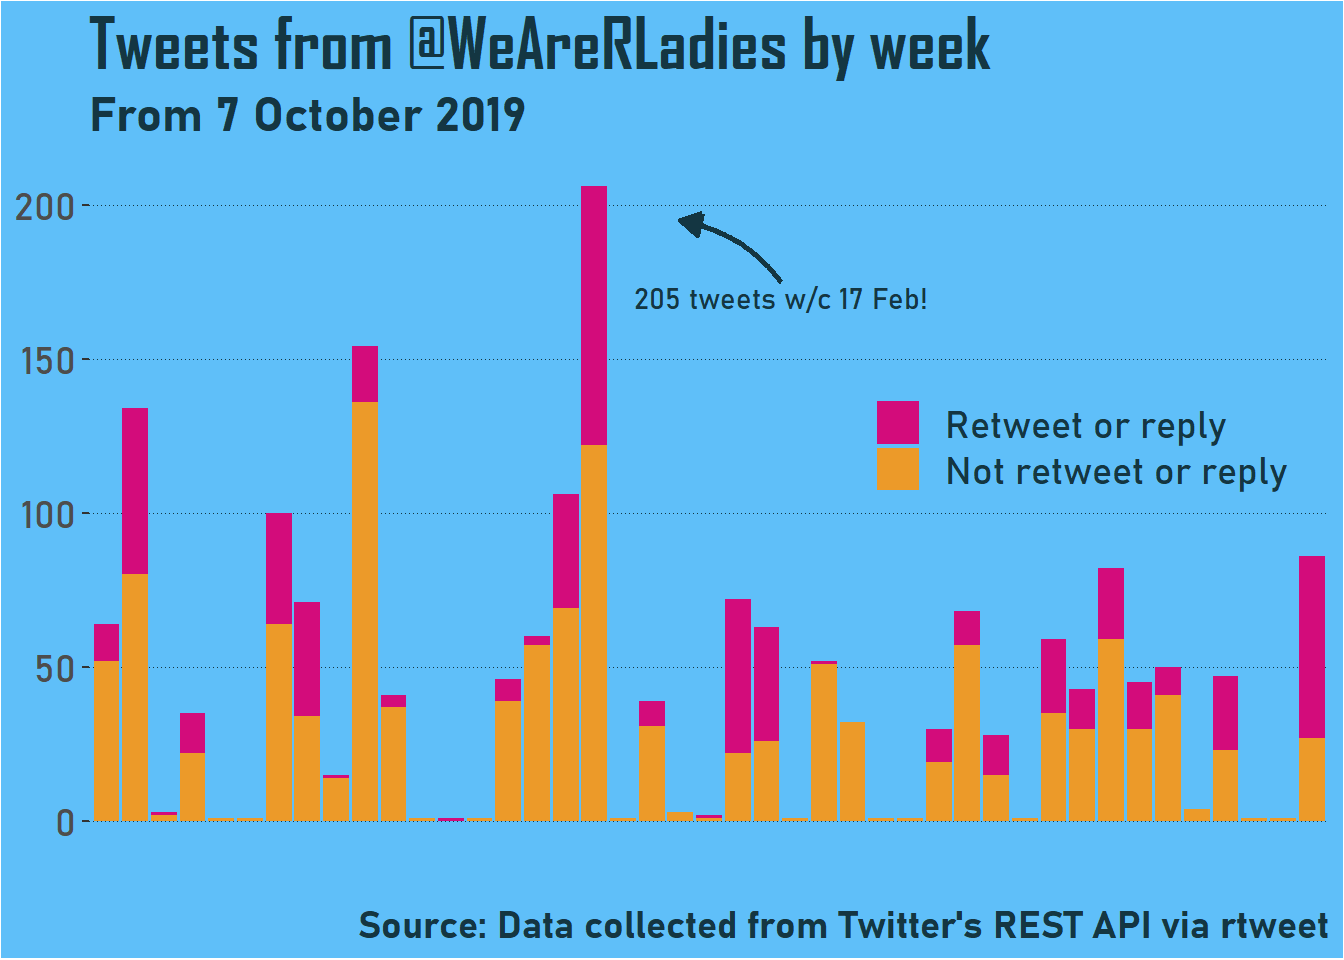 You can see that there are some weeks when there was a break between curators. You can also see curators are totally different - both in terms of number of tweets and the number of retweets and replies. One curator tweeted over 200 times!
To get more of a sense of range, I looked at the number of tweets a week and plotted some boxplots.
# Number of tweets each week for each tweet category
week_counts <- rladies_tweets[, .N, by = c("week_start", "not_reply_retweet")]

# Number of tweets each week that are a reply/retweet
week_counts <- week_counts[!not_reply_retweet == FALSE]

# Total number of tweets each week (all categories)
all_week_counts <- rladies_tweets[, .N, by = week_start]
all_week_counts[, not_reply_retweet := FALSE]

# Combine data
week_counts <- rbind(all_week_counts, week_counts)

# Remove weeks with 0 or 1 tweets
week_counts <- week_counts[N > 1]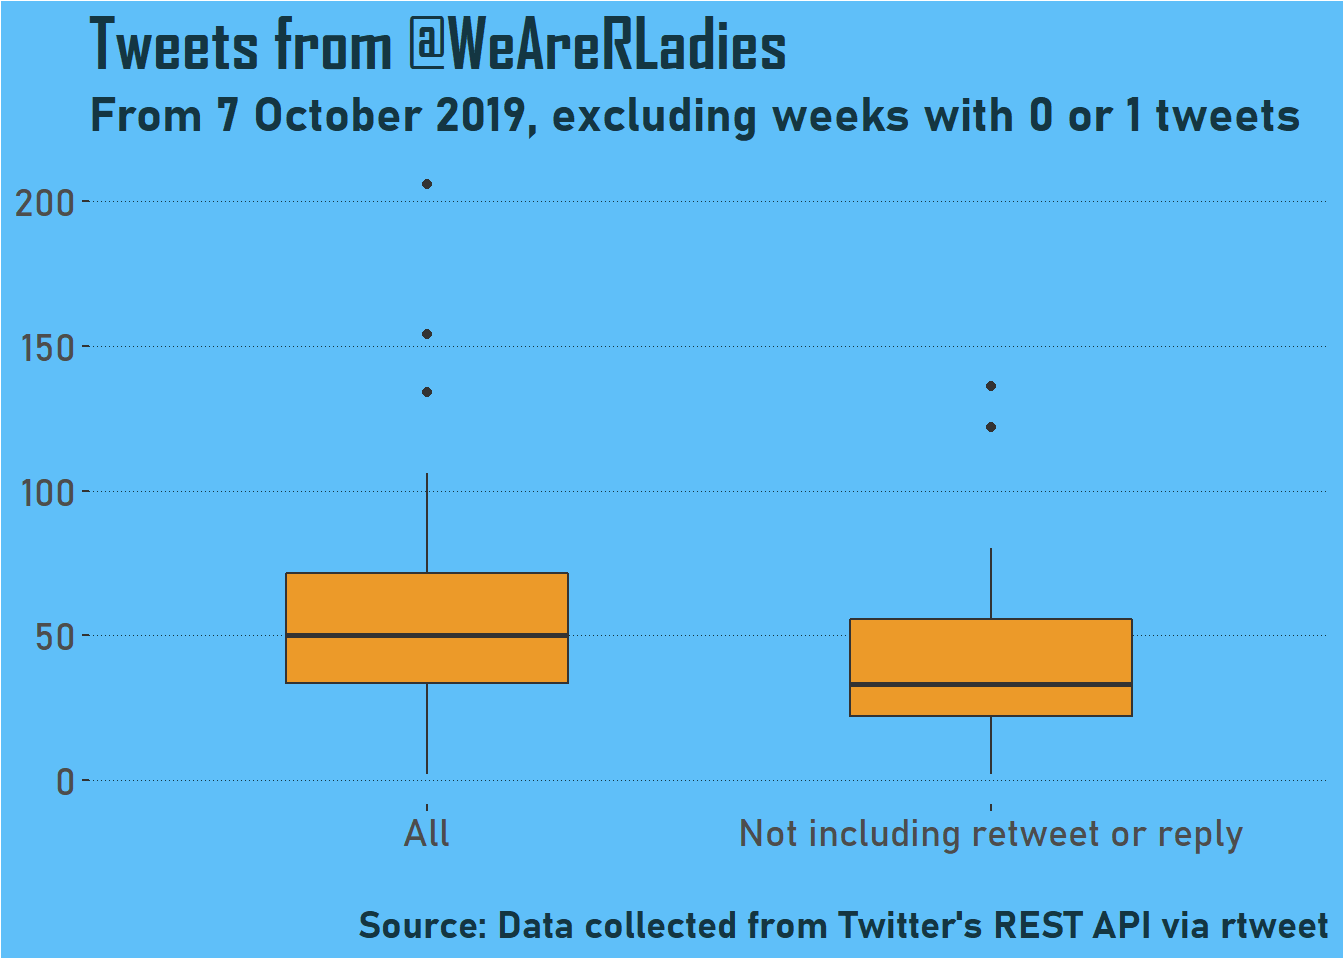
You can see that the median is around 50, although about 35 to 70 looks pretty normal. That’s including retweets and replies - otherwise the median is about 30.
How did I do in the end? I looked at the data and found out I tweeted 61 times, and 8 of those were retweets/replies. I’m a bit surprised because at the time I wondered if I was active enough, but it looks like I was doing very averagely for the account. Which is what I wanted!
In my next post, I’ll go into more detail about what ‘normal’ looks like on this account, such as levels of engagement and tweet timing.