Sometimes code has to be slow. If you’re running an incredibly complex model with zillions of data points? Yeah, you might want to put the kettle on. But even if you are realistic about the running time of your project, there are almost always ways to make it go faster. And shaving seconds off can be very satisfying!
So, if you haven’t used the profvis package before, you are in for a treat. It’s a great tool for identifying problem patches in your R code that are slowing everything down. It won’t give you the solution, and perhaps there won’t be one, but if speed is important in your project, you’ll know where to focus.
This weekend, I used profvis to examine my Words in Shakespeare app. It was working, but loading it up each time was taking longer than I would have liked. So I thought I would use it as an example case in using profvis.
You can actually use profvis to analyse your entire shiny app. That would be as simple as wrapping the runApp() function in the profvis() function:
library(profvis)
profvis({
  runApp()
})
However, I knew that the issue was with the app loading, not with activity that happens when using the app. Instead, I went to my global.R file and wrapped everything in the script with profvis({}).
After several seconds, this resulted in the following report:
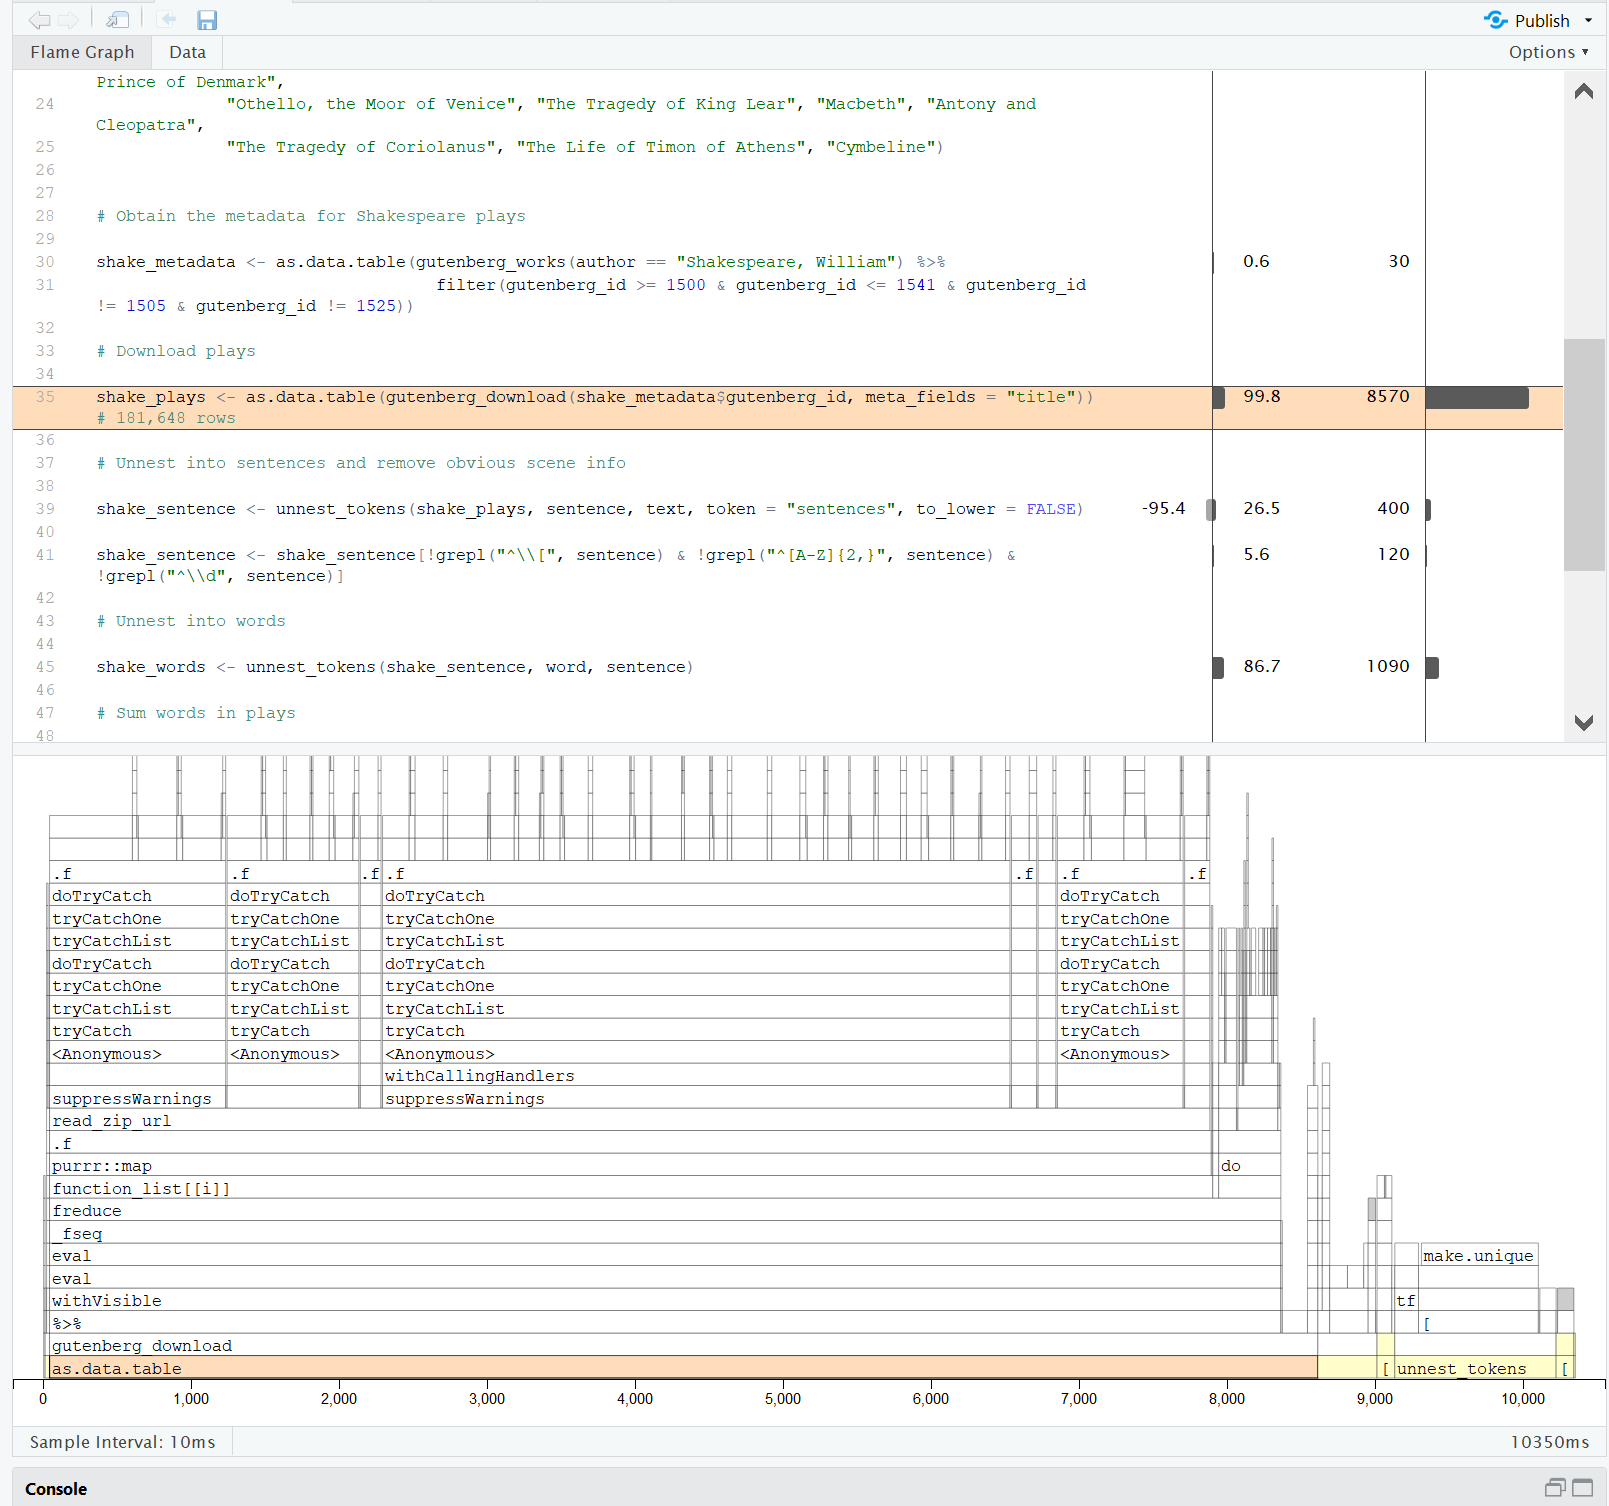
There are a few parts to this report:
The code: In the top section, you can see the code, same as you can in your script. What’s different is that every line of code has some bars next to it. The bar on the left shows the memory being used; the bar on the right shows the time taken to run this line of code in milliseconds. I can see immediately that my biggest problem is the line where I download the play data using the gutenbergr package. Which totally makes sense, right? It’s a lot of text data to pull into the project. It takes just over 8.5 seconds - not long if you are doing it once, but super annoying for app users.
The flame graph: On the bottom in the screenshot is the flame graph. This shows what is happening over time. Again you can see here that as.data.table is stretching across almost all the graph, signifying that it is taking all that time to run. Stacked on top, you can see the code underlying that line, so you can also see that gutenberg_download might be a crucially slow part of that. Note that because I’ve clicked on the line of code in the top section, it’s highlighted in the flame graph. Also, you can see that the second longest chunk belongs to unnest_token - only one second this time, but not totally negligible.
The data tab: You can flick between the flame graph and a data view using the tabs at the top. This simply gives you a tabular version of the profile.
Speeding things up
The problem is clearly that the app has to pull in a substantial file. To some extent, that is inevitable, but there are ways to make a difference.
The first thing is to write the dataset as a feather file. Feather is a particularly fast file format; you can read about it here if it’s new to you. It’s lightweight but retains information about the data such as the data type of each column, which is really useful. Using the feather package, I wrote the relevavnt datasets to feather files and saved them in the repo of the app. (With larger files, you might need a different data storage solution.)
Given that I’m saving the dataset myself anyway, it makes sense to do as much of the data wrangling as possible before writing the feather file. In the app, some of the data changes depend on the input of the user, but that is all done in the reactive expressions in the server.R file. Pretty much everything in the global.R file can be passed through to a dataset that then gets called in future.
Taking these steps gave me the following profile:
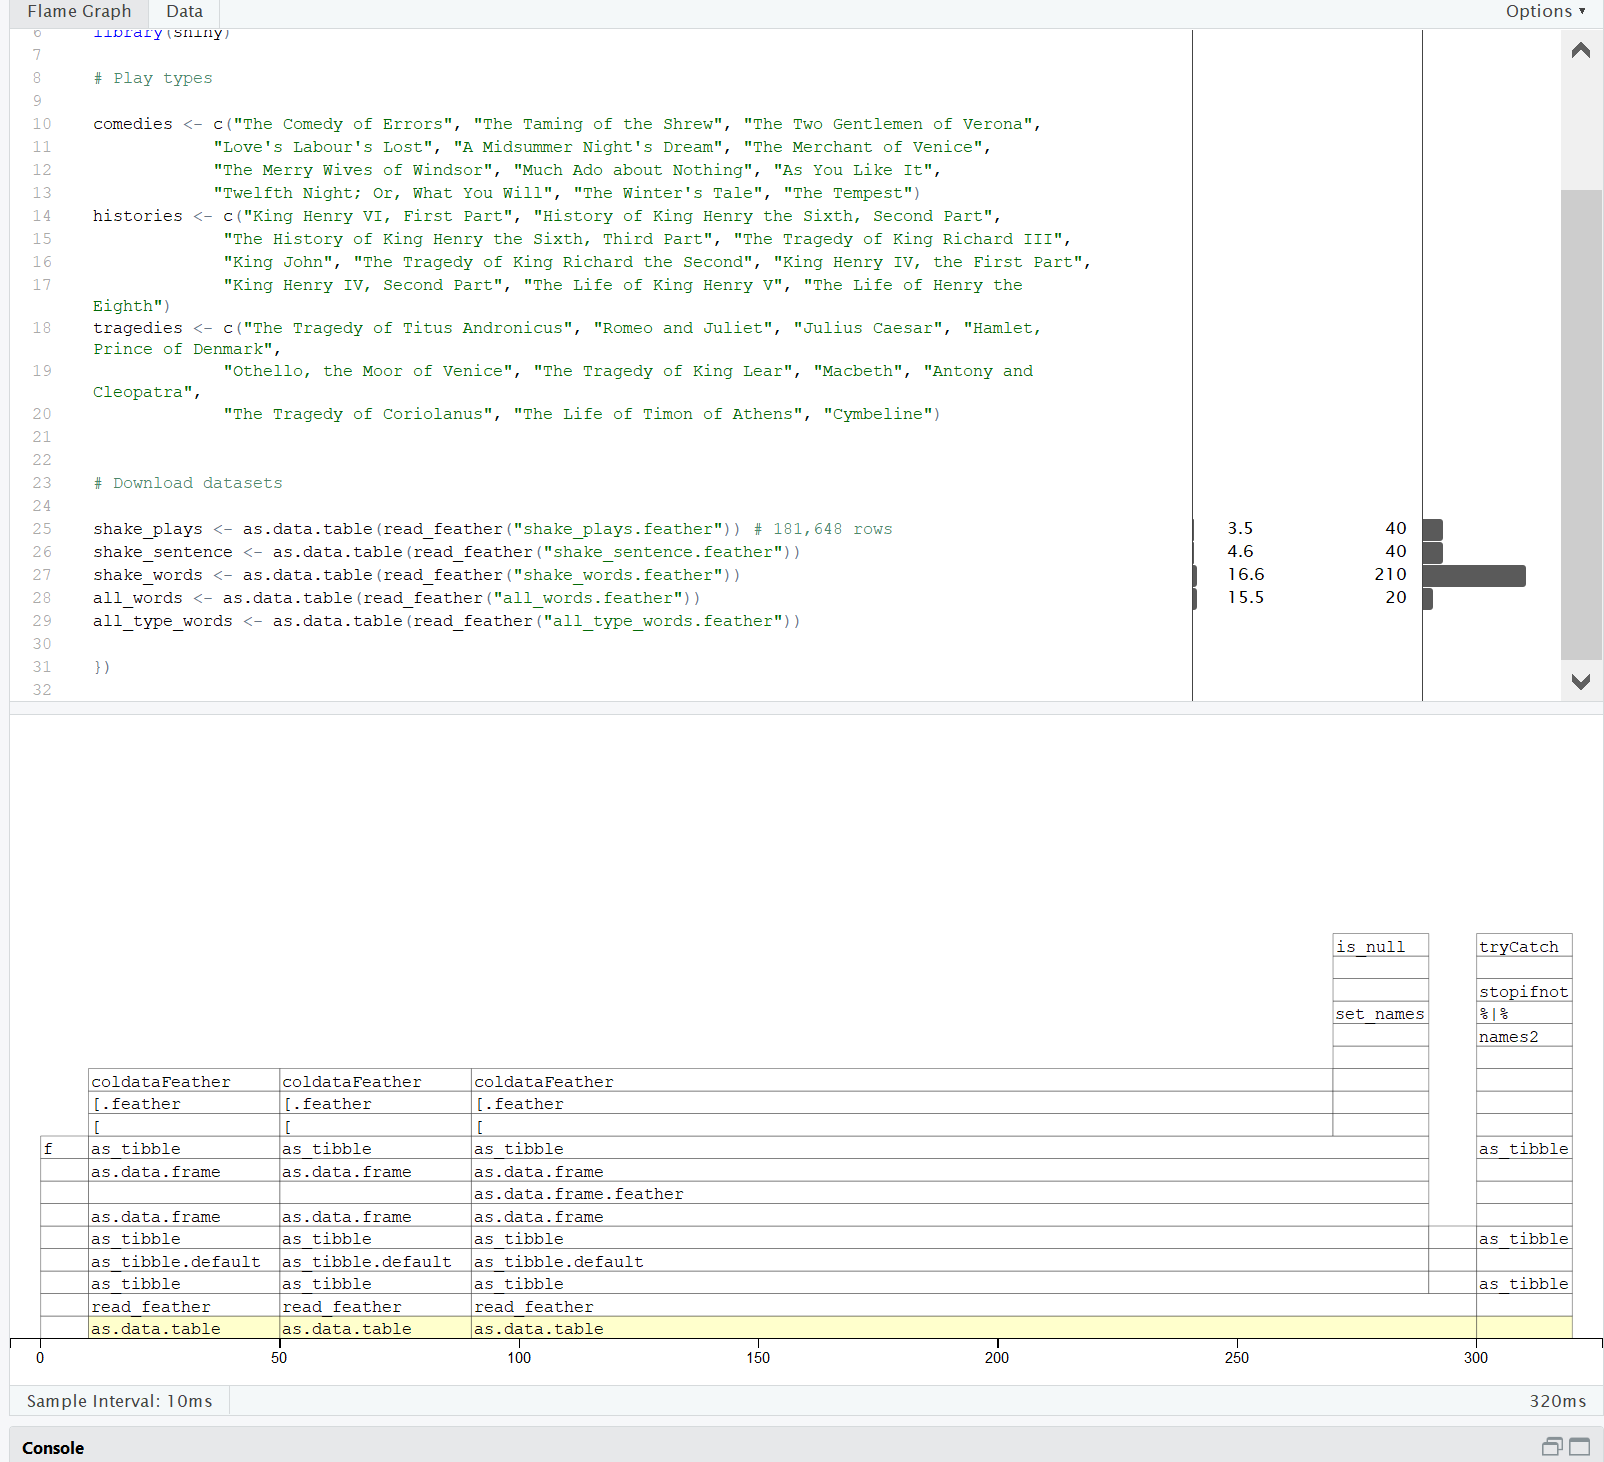
What a difference! Now the whole thing takes 320ms - less than half a second.
You can check out my Words in Shakespeare app here, loading much faster than it used to.