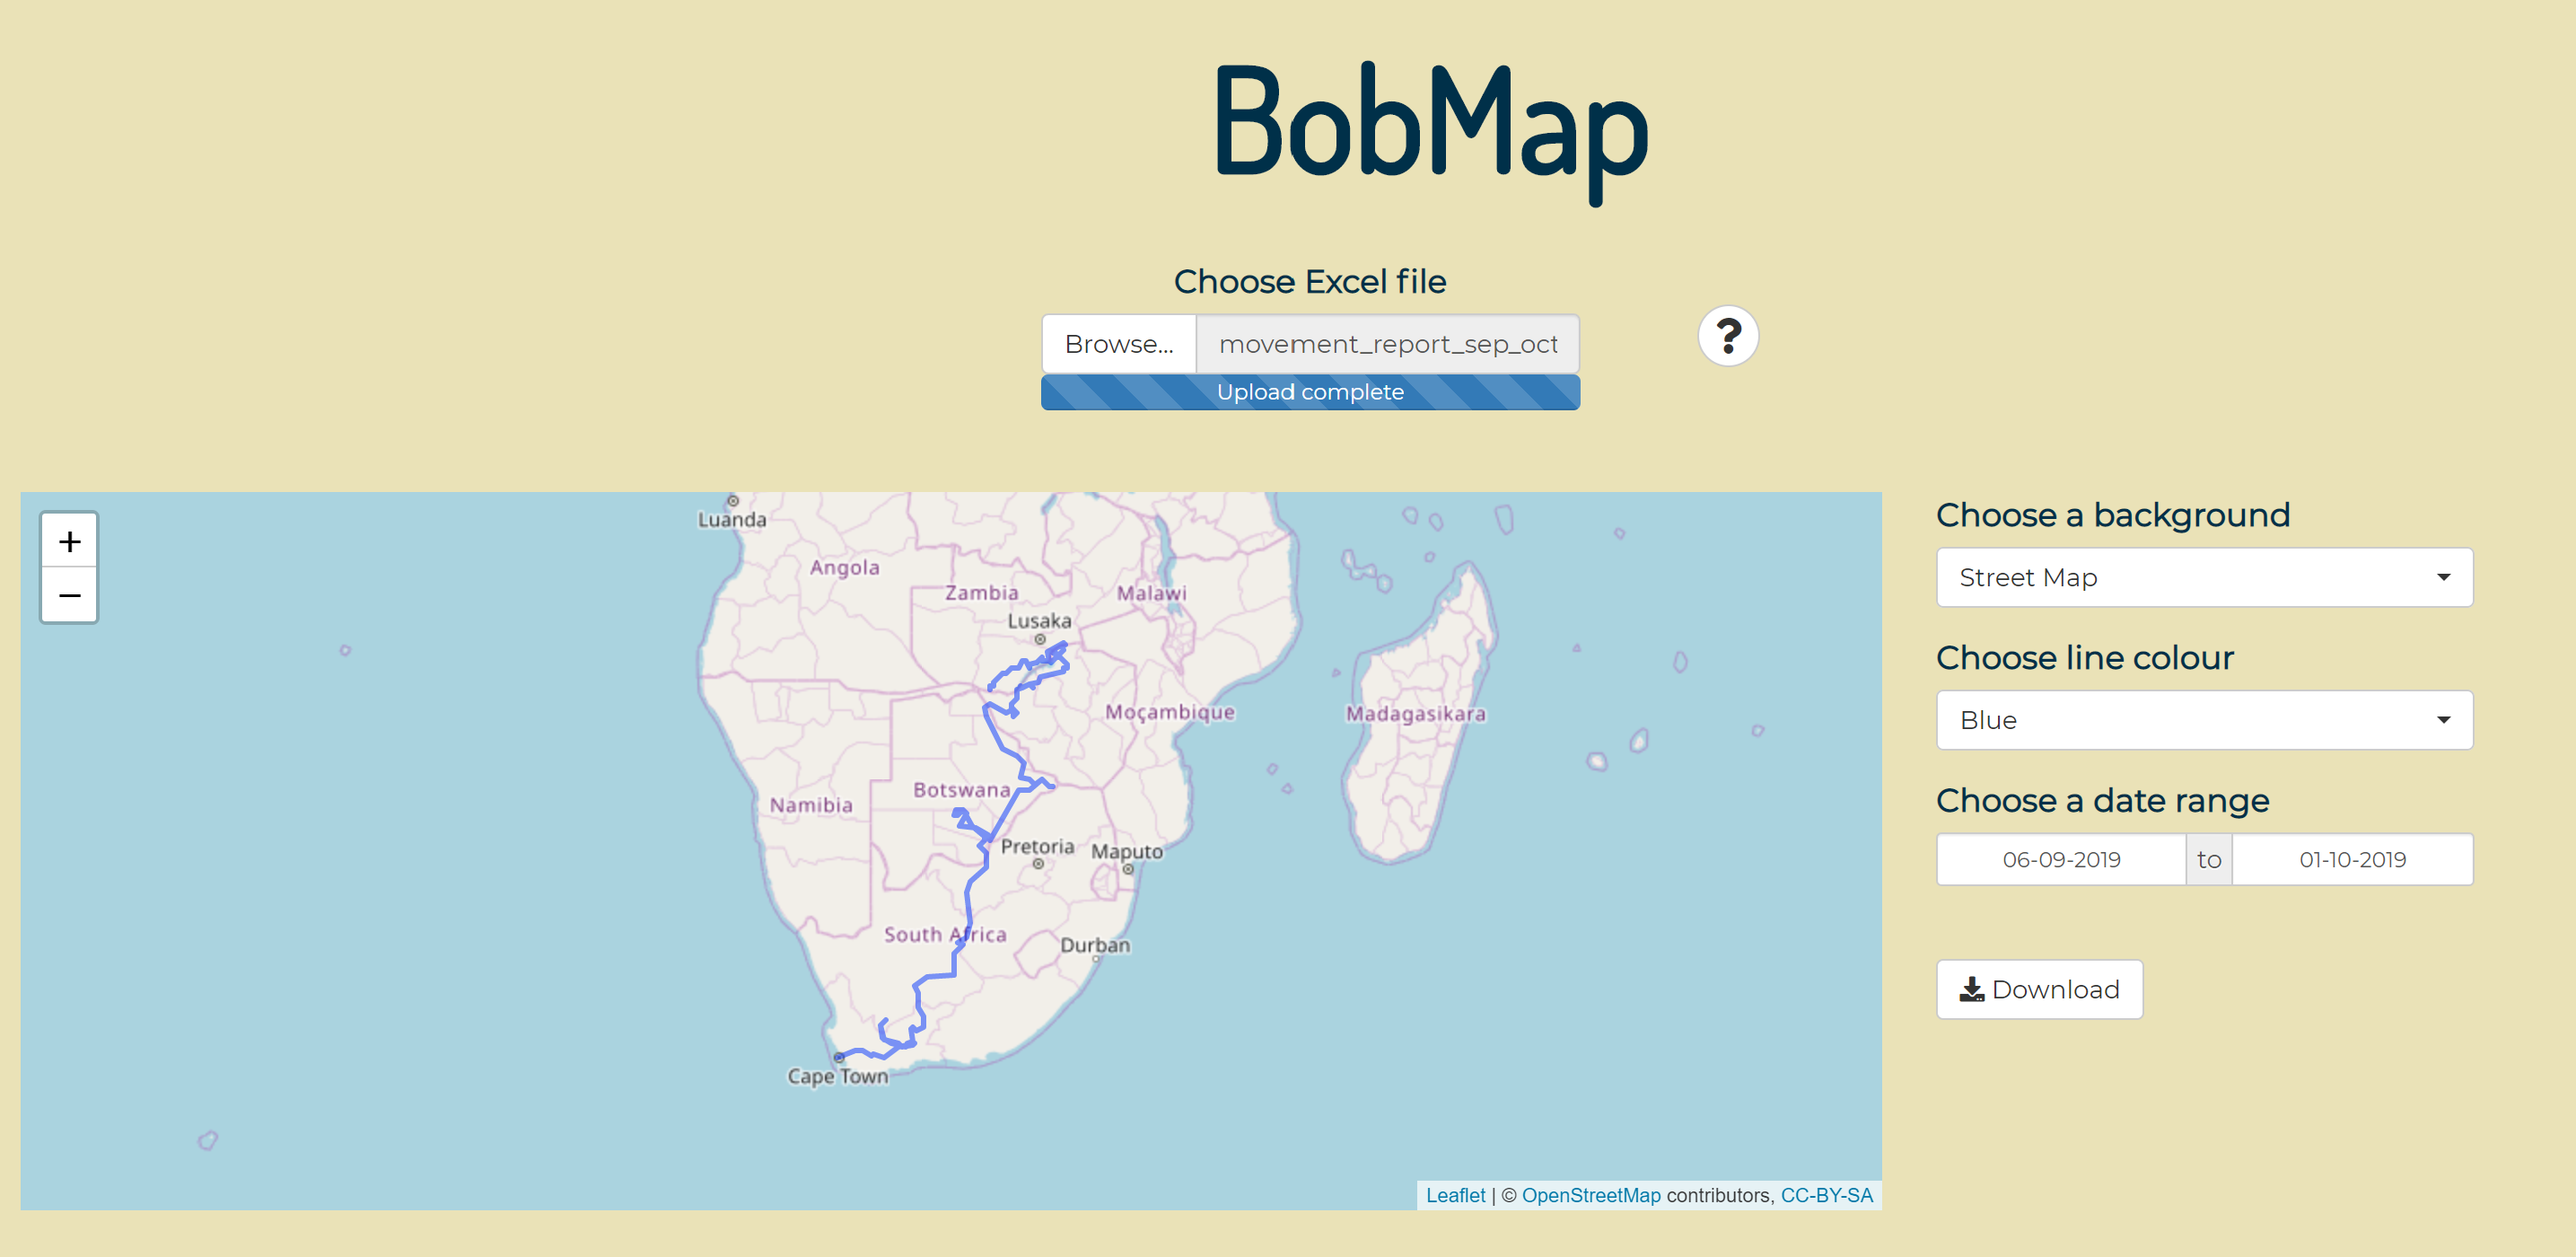
A while ago, my Dad asked me to look at the file he had as an output from his GPS. He does regular cross-country driving trips in Southern and East Africa, with his GPS capturing his location every couple of minutes. He ultimately wanted to plot his route on a map but was asking me to just tidy up the coordinates so they were more usable. After doing this for him, I thought there might be a way I could create a tool for him to use to plot his route with just the excel file from the GPS as an input. So for Christmas, I created a shiny app for him called BobMap.
With this, the user can upload their excel file and get an output of a map with their route plotted across it. There are some additional options to change the look of the map and route line, and choose the dates to focus on.
There are a couple of things I wanted to do in this post, other than show off about my present ideas. Firstly, I would really like to make this tool usable to others, but at the moment it is reasonably restricted to the file my Dad gave me originally. I assume other GPS systems will have different structures so I would really like to see other examples. If you have a file like this, I’d love to see it or hear about it! Please comment here or contact me on Twitter.
Secondly, I thought I would write a bit about my experience of working with spatial data for this project, as I hadn’t done much previously. The location I had in the file looked like this: E025° 50' 38 S17° 50' 44. These are Eastings and Northings, but for my leaflet map output I needed latitude and longitude.
It’s possible to do this with char2dms() from the sp package, but I also needed to wrangle the string a bit first to get it into something the function would understand. I would need two strings that looked like this before converting: 25° 50' 38"E for longitude and 17° 50' 44"S for latitude.
This example works for the specific string given; in the app itself I have slightly more going on to deal with different possible inputs.
library(data.table)
library(stringr)
library(sp)

# Create example data.table with original string

coords <- data.table(original = "E025° 50' 38 S17° 50' 44")

# New column taking the bit to convert to longitude -
# everything in the first half.
# Also add the required ending letter E.

coords[, long_orig := gsub(" [S]", "\"E",
                         str_extract(original,
                                     "^.*?(?<=[S])"))]

# New column taking the bit to convert to latitude -
# everything in the second half.
# Also add the required ending letter S.

 coords[, lat_orig := paste0(
      str_extract(original, "(?=S).*"),
      "\"S")]

# Remove the unnecessary letters at front of strings

coords[, `:=` (
      long_orig = gsub("E0|S(?=\\d)", "", long_orig, perl = TRUE),
      lat_orig = gsub("E0|S(?=\\d)", "", lat_orig, perl = TRUE)
    )]

# Convert using char2dms, specifying the separators

coords[, `:=` (
      lon = as.numeric(char2dms(long_orig,
                     chd = "°",
                     chm = "'",
                     chs = "\"")),
      lat = as.numeric(char2dms(lat_orig,
                     chd = "°",
                     chm = "'",
                     chs = "\""))
)]| original | long_orig | lat_orig | lon | lat |
|---|---|---|---|---|
| E025° 50’ 38 S17° 50’ 44 | 25° 50’ 38"E | 17° 50’ 44"S | 25.84389 | -17.84556 |
That results in a lon and lat column that will be recognised when using leaflet for maps.