When I shifted career into data science, I never thought that one of the first things that would really hook me in would be discovering new, elegant ways to structure and manipulate data. That sounds kind of boring, right? Especially compared to super sexy artificial intelligence. But as you probably know, the reality of a data-driven field means, um, working with data - so you need to clean it, turn it upside down and inside out, rearrange everything to suit your purpose, spread it all out and then tidy it up before you can even get started on your fancy machine learning. Having good tools for the everyday tasks therefore makes a huge difference.
Somewhere along the way, I’ve become a total convert to the R package data.table, to the extent that yesterday, I gave a presentation about it at an R-Ladies London event. This post is a little slice of that talk, so you’ll understand why I advocate for data.table. But first…
What is data.table?
A datatable is a pretty generic term for data structures, but in the context of the R package, we are talking about something more specific. It is both a type of data structure (which in this post I will call a data.table, with the dot) and a means to edit and use that data through a syntax that differs from base R (as well as differing from dplyr, which is probably the package more frequently taught), accessed by downloading and using the package data.table.
Actually, a data.table is also a type of data.frame, which means that code you would use to interact with a data.frame will also work with a data.table. So even if you are a little anxious about trying a new structure, you won’t be too far from familiar territory!
Why I use data.table
1) It’s so fast
Speed is important in data science. This is obviously true when you are running complex models and using exceptionally large datasets, where there is a real likelihood of things slowing right down. But it’s also true for simpler tasks that get done over and over again. For example, users of your shiny app are not going to be very tolerant of waits of more than a few seconds for things to load.
And data.table is fast. Not just compared to other options in R, but tools in other languages too. This benchmarking of database-like tools from R, Python and Julia was last updated two weeks ago (19th May 2019) at the time of writing this post, and it shows data.table as substantially faster across a number of aggregation tests using datasets of varying sizes. With a dataset of 50GB, data.table takes 112 seconds to process the five tasks, compared with 2,539 seconds for dplyr. Meanwhile, pandas is not able to complete the tasks at this data size due to insufficient memory in the test environment. If you click through the tests and data sizes, you will see on occasion a different tool will beat data.table - but in those instances, data.table will be second, with no other tool coming consistently in the top two for every task.
Additionally, its fread() and fwrite() functions are quick ways to read in and write data (here is an example of a recent benchmark comparing fread() with read.csv()). Lots of people use these functions even if they don’t use the wider data.table capabilities.
There are a number of reasons why data.table is fast, but a key one is that unlike many other tools, it allows you to modify things in your table by reference, so it is changed in-situ rather than requiring the object to be recreated with your modifications. That means that when I’m using data.table, I need to use <- far less frequently. If it isn’t obvious why that’s quicker, imagine you’ve written a long email to somebody, and then notice a typo you want to change. A tool like data.table means you can just alter that word, rather than rewriting the whole thing.
2) It makes sense
Once I learnt the basic syntactical structure of data.tables, everything totally clicked. I know that many people find dplyr easy to read, but for me, the consistency and simplicity of data.table make it super easy for me to look at pretty much any data.table syntax and just get it.
This image from a wiki provided by the creators of data.table is a good introduction.
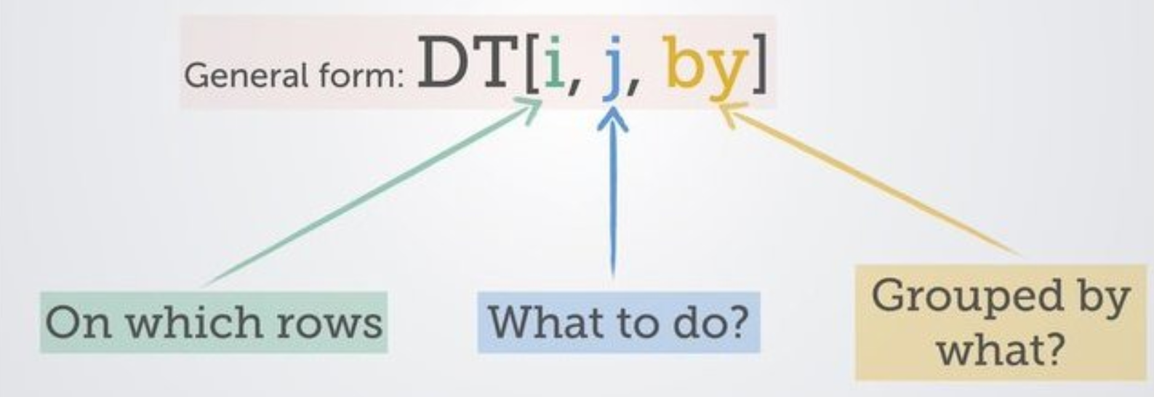
Within the square brackets that signify you are doing something to your data.table, there are three sections to consider. You can do a lot with these building blocks and simply by understanding these you will be able to interpret most data.table code.
- i: The first section is where you specify the rows that you want considered. It’s a place to filter or subset.
- j: Stuff that’s going on in columns - you might be making a new one or modifying an existing one, for example. Generally where the action is happening.
- by: Doing stuff by group - which is ridiculously handy to be able to do within this same line of code.
If you aren’t used to data.table, then it can look intimidating simply because it is using syntax that isn’t the same as other R code. There are distinct ways of doing things (such as := for indicating a change to a column, or .N to count rows). However, these elements are often what make data.table so handy, and you quickly get a hang of them.
3) It’s the hipster choice
Using a tool other than the one most commonly taught could be a sign that you don’t know what you’re doing. Conversely, I say to you, it could be a sign that you really do know what you’re doing. Doesn’t bucking the trend make you a data science badass? I say yes.
But seriously, it isn’t like data.table is at all fringe. It’s been around since 2006. It has around three quarters of a million downloads each month. And both dplyr and data.table have similar usage within other packages, each powering about 10-12% of CRAN.
So really it’s the best of both worlds. It’s totally got the backing of the R community and has proved itself an excellent resource, but gives you that little bit of a cool, free-thinking vibe.
What next?
Now you have been 100% convinced to use data.table, here is some more to look at:
- The data.table site
- The data.table FAQ
- A data.table and dplyr tour (includes comparison of operations in both packages)
- Advanced tips and tricks with data.table (this is so good! Really helps you go to the next level)
You can also find my presentation slides here.
I hope that helps and you join me on Team data.table!