We’re back looking at tweets! This is going to be my last post in this series. In my last two posts, I looked at how often curators of @WeAreRLadies tweet. Today, I’m going to look at hashtag usage, and which hashtags lead to the most retweets and likes.
First, like last time, I’ll load the data and create the plot theme.
library(data.table)
library(ggplot2)

extrafont::loadfonts(device="win") #ensure fonts are loaded


rladies_tweets <- fread('rladies_tweets.csv')
rladies_tweets <- rladies_tweets[, .(created_at, text, favorite_count,
                                     retweet_count, hashtags, status_id)]


plot_theme <- theme(
  plot.background = element_rect(fill = "#5FBFF9"),
  legend.background = element_rect(fill = "#5FBFF9"),
  legend.key=element_blank(),
  panel.background = element_rect(fill = "#5FBFF9"),
  text = element_text(colour = "#143642",
                      family = "Bahnschrift",
                      size = 16),
  title = element_text(face = "bold"),
  plot.title = element_text(family = "Agency FB",
                            size = 22),
  panel.grid.major.y = element_line(colour = "#143642",
                                    size = 0.2,
                                    linetype = "dotted"),
  panel.grid.major.x = element_blank(),
  panel.grid.minor = element_blank()
)

tweet_cols <- c("#D30C7B", "#EC9A29")
I want to work with a dataset that has one line per hashtag per tweet - so if a tweet has no hashtags, it won’t be in the dataset, whereas a tweet with two hashtags will be in the data twice, with a different hashtag in the relevant column.
Because this was saved as a csv, some formatting changed from the original dataset from rtweet so I put the hashtags back into a list before transforming the data.
# Remove tweets without hashtags
hashtag_data <- rladies_tweets[!hashtags == ""]

# Turn hashtags into lists
# (they would normally be lists from retweet but csv saving changed them)
hashtag_data[, hashtags := as.list(strsplit(hashtags, '\\|'))]

# One row per hashtag per tweet
unlist_hashtag_data <- hashtag_data[, .(hashtag = unlist(hashtags)),
                                    by = status_id]

# Merge data so each hashtag has all the info
hashtag_data[, hashtags := NULL]
hashtag_data <- merge(hashtag_data, unlist_hashtag_data,
                      by = "status_id")
hashtag_data[, hashtag := tolower(hashtag)]
With this dataset, I can look at the number of times each hashtag was used. Here are all the hashtags used at least 20 times in the year.
use_data <- hashtag_data[, .(uses = .N),
                         by = hashtag]
use_data <- use_data[uses >= 20]

ggplot(use_data, aes(forcats::fct_reorder(hashtag, uses), uses)) +
  geom_col(show.legend = FALSE, fill = tweet_cols[2]) +
  plot_theme +
  coord_flip() +
  labs(
    x = NULL, y = NULL,
    title = "Number of times hashtags used",
    caption = "Tweets from @WeAreRLadies, Year from 7 October 2019\nSource: Data collected from Twitter's REST API via rtweet"
  )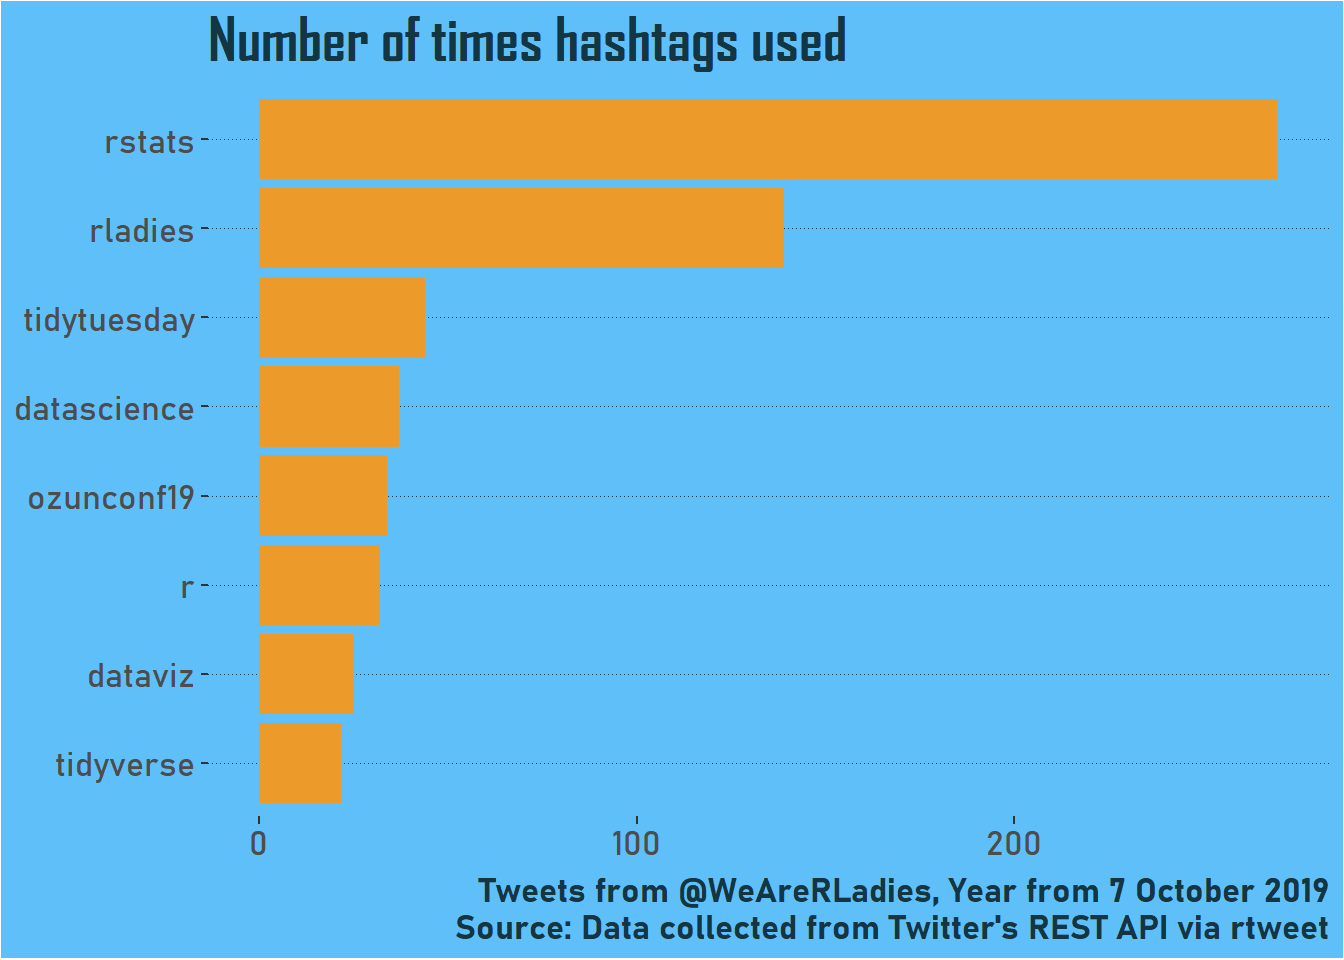
Most of these are hashtags that were probably used across the year; no surprises that #rstats and #rladies feature highly! Conversely, #ozunconf19 probably reflects a lot of tweeting in a concentrated period around that conference.
To understand engagement better, let’s look at the median number of likes for each hashtag based on the tweets containing it. These ones all have a median of at least 10 likes.
like_data <- hashtag_data[, .(likes = median(favorite_count), uses = .N),
                          by = hashtag]
like_data <- like_data[uses >= 5 & likes >= 10]

ggplot(like_data, aes(forcats::fct_reorder(hashtag, likes), likes)) +
  geom_col(show.legend = FALSE, fill = tweet_cols[2]) +
  plot_theme +
  coord_flip() +
  labs(
    x = NULL, y = NULL,
    title = "Median likes for tweets containing each hashtag",
    caption = "Tweets from @WeAreRLadies, Year from 7 October 2019\nSource: Data collected from Twitter's REST API via rtweet"
  )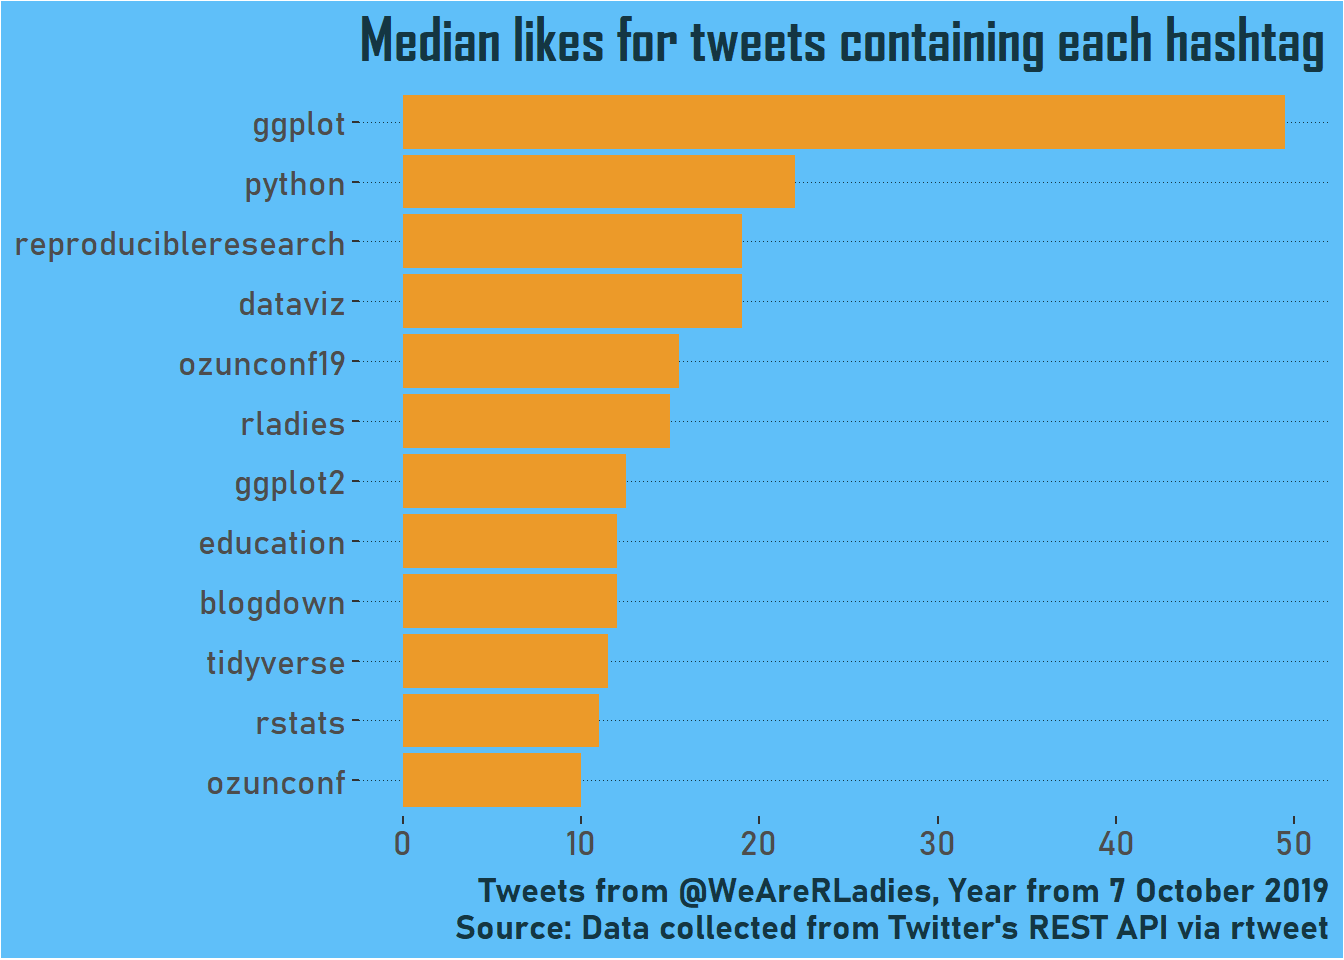
The conference makes it in again! So do #rstats and #rladies, but there are also a lot of tools and relevant themes. The best is #ggplot, which is not surprising perhaps as a widely used tool where the outputs are visual and therefore pretty good for social media. It’s also accessible - entry level R users will be familiar with it early on in their learning.
I’m intrigued to see #python so high! I looked at the top tweets with the hashtag for more context…
hashtag_data[hashtag == "python"][order(favorite_count)][1:3][, text]## [1] "@imallieburns @mxslk The programming languages that seem to be the most used in #datascience are #R (which gives you a head start) and #python. The good news is that if you learn one, the other one will be relatively easy to learn. learning to use #SQL and run queries is also super important!"
## [2] "Iâ\200\231ve used the package â\200œreticulateâ\200\235 in the past for regressions on housing prices and forecasting. Does it have other uses to you? \n\nAnd what packages other than reticulate merge #Python with R?"
## [3] "Decided to move to #datascience, I realized there were sooo many things I could learn or events to attend that I felt overwhelmed 🤯 I decided I couldn't learn all together #python, #Machinelearning, #SQL etc, *while also finishing my PhD* so now I work on my skills more serially https://t.co/pGE003I4Ms"My impressions is that #python comes up either when people are talking about starting out in data science, or integrating python in their R workflow. Tweets about starting out look very popular, I guess because they are relevant to many followers!
Finally, I’m going to check out median retweets for hashtags. These all have median retweets of at least 5.
retweet_data <- hashtag_data[, .(retweets = median(retweet_count), uses = .N),
                             by = hashtag]
retweet_data <- retweet_data[uses >= 5 & retweets >= 5]

ggplot(retweet_data, aes(forcats::fct_reorder(hashtag, retweets), retweets)) +
  geom_col(show.legend = FALSE, fill = tweet_cols[2]) +
  plot_theme +
  coord_flip() +
  labs(
    x = NULL, y = NULL,
    title = "Median retweets for tweets containing each hashtag",
    caption = "Tweets from @WeAreRLadies, Year from 7 October 2019\nSource: Data collected from Twitter's REST API via rtweet"
  )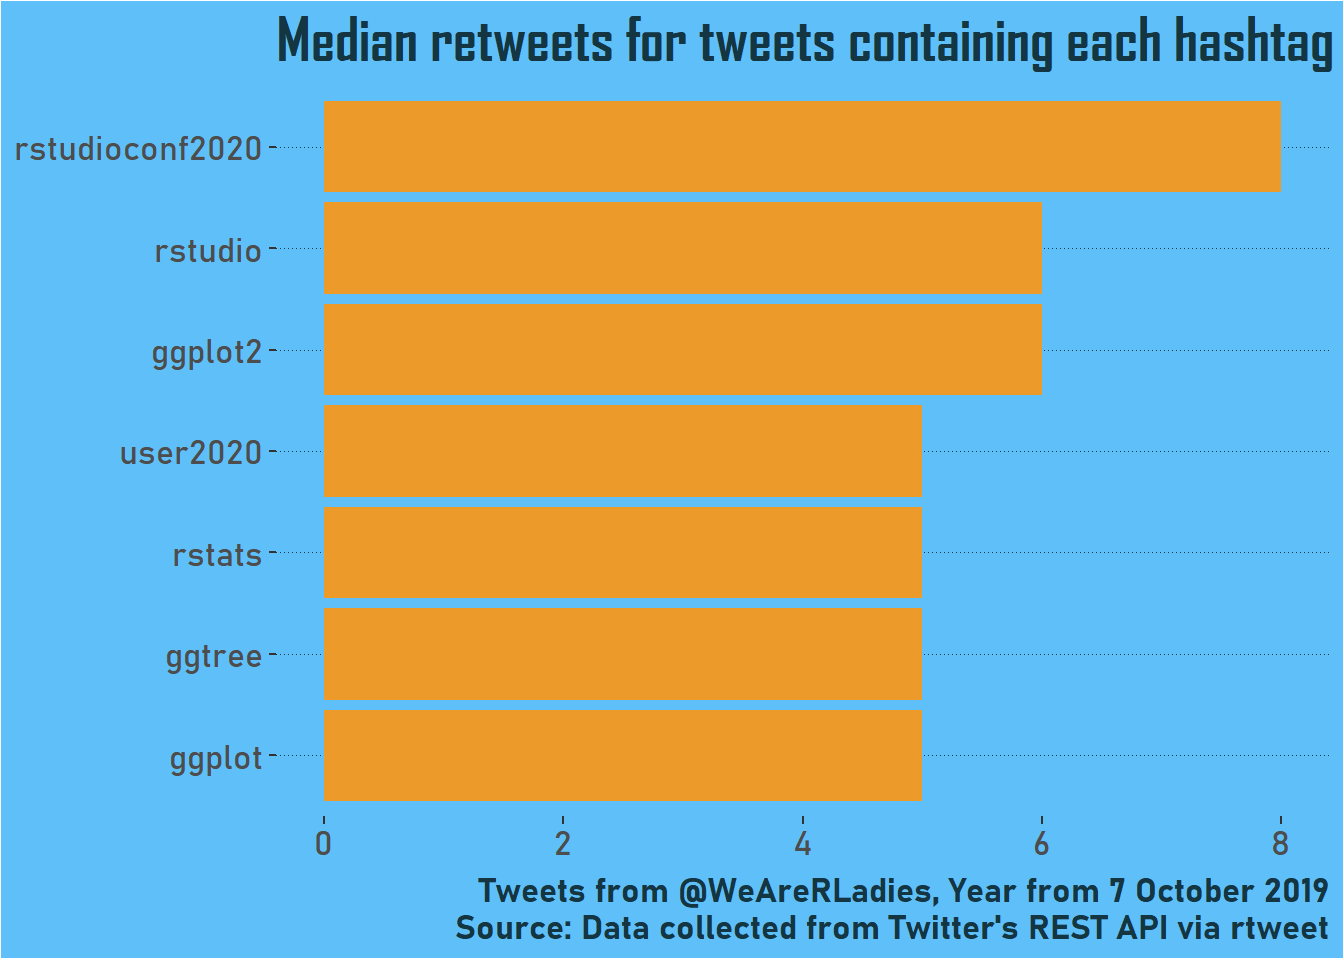
Conferences make a stronger appearance here, which also makes sense as they are more social events and there are likely to be more people actively retweeting and broadcasting by searching for hashtags.
My advice to curators would be to tweet about what you want, because you’ll be more engaging if you are talking about something you are interested in! But it looks like for retweets, it’s worth tagging in a conference, and for likes, you do well talking about common data science tools and widely used packages.