Over the past few months, I’ve spent a lot of my personal project time on web scraping. This was core to the first step of the asylum data project that I wrote about recently, and I’ve also been scraping audience reviews of shows at the Edinburgh Fringe Festival - hopefully my next post will look at sentiment analysis and other considerations of which shows actually get reviewed.
Other than that, I’ve had the opportunity to attend a couple of useful meetups and undertake some training courses, so I’ll use this space to summarise those this time.
NLP and efficient data storage
I’m about halfway through the Natural Language Processing (NLP) course recently released by fast.ai. Rachel Thomas is a very clear instructor and I’m finding it engaging and easy to follow along - something which can be a problem with online courses! This is especially true because it uses Python, which is newer to me than R, but I’m finding this a good way to get familiar with some Pythonic ways of working because there is a lot of visible code.
The thing I particularly thought would be nice to highlight here isn’t specific to NLP, but a more generalisable lesson on using and creating efficient data storage formats. Sparse data, where a lot of the values would be 0 or empty, can end up taking a lot of space while representing fairly limited information. This is often relevant when working with language, because there are so many possible words, but each individual sentence / paragraph / chapter / post / review / article will only use a tiny proportion of those.
The course introduced me to some alternative ways of storing sparse data. You can see the part in the relevant lessen here, but I’ll summarise a couple of key ones below.
Remember that in Python, counting starts at 0, so your first value, row or column will be 0 rather than 1.
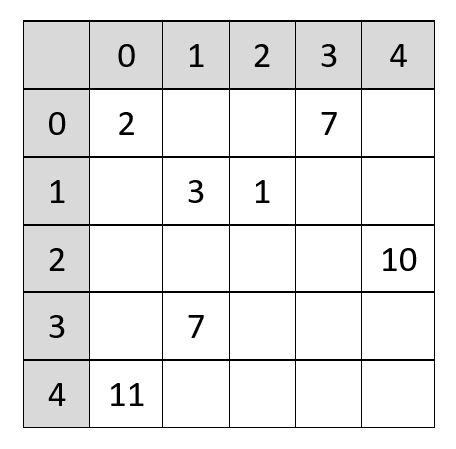
Here’s a sparse matrix as an example to refer to with these different approaches:
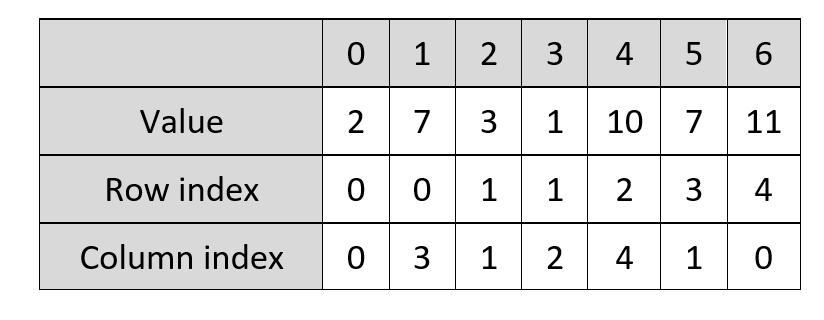
Coordinate-wise
The matrix is stored in three arrays:
- The value of the non-zero elements
- The row index of the non-zero elements
- The column index of the non-zero elements
Looking at our sparse matrix, the first value (2) is in the first row (0) and first column (0), so those are the values that would be stored at the first index in each relevant array. The second value (7) is in the first row (0) as well, but the fourth column (3), so we store those numbers in the second index. You see how we skipped over having to store any numbers for the two empty cells between those two values? So on the one hand, you have to store three values to access each individual value, but you still save space overall because there are so many cells you don’t need to store. And like the name suggests, it’s basically like coordinates: you know the row and column, and marry them together to get the exact position.
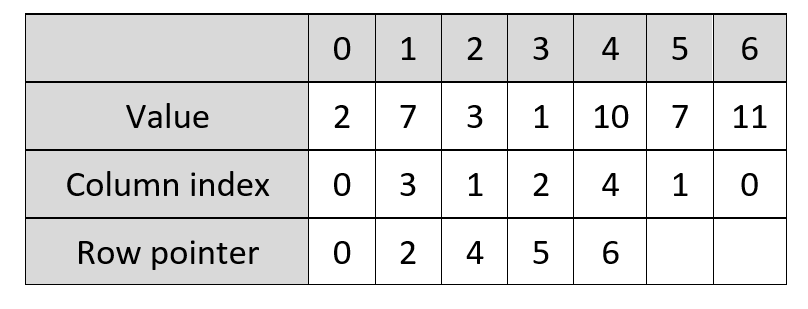
Compressed Sparse Row
The matrix is stored in three arrays:
- The value of the non-zero elements
- The row index range of the non-zero elements, or row pointer
- The column index of the non-zero elements
As you can see, this looks pretty similar, but the one change is how we identify rows. In this array, rather than telling us what the row index is of a particular value, it logs when the row index increases. This can look a bit more confusing, because the row index pointer of a given index within the arrays won’t directly relate to the value and column index at the same index in their arrays. However, it saves more space than the coordinate-wise approach.
To give more of an example, looking at the sparse matrix, again the first value is 2 and the first column is 0, and the second for each of those is 7 and 3. Meanwhile, the row pointer is doing its own thing. It notes that the first value in the first row is the first value of the matrix, so it still has 0 in the first space of its array. However, for the next row pointer value, move down to the next row. The first value in the second row is the third value of the matrix overall, so the row pointer value is 2 to indicate this (remembering that in Python, 2 means the third value as we are counting 0 as the first value). This means there is only a row point value once per row, so five times in our example - there isn’t a value for every non-empty value.
In this format, it is easy to pull out an individual row of data, but not an individual column without a bit more work. There is, however, also the option of doing this the other way round, with a column pointer, which is a format called Compressed Sparse Column.
Chatbots
In July, I went to a workshop to build a chatbot, using RASA in Python. This was an interesting insight into chatbots. I think what we were doing was fairly early level stuff, but it was a lot more structured and rule-based than I had realised. Part of it involved essentially writing a likely flow of questions/events, so trying to anticipate what people interacting would ask, and working out how to deal with issues where the chatbot didn’t get an answer it understood. This meant the chatbot was very practical rather than conversational - better with a few clear goals than being overly discursive.
Then, by feeding in several examples of the types of responses they might expect from humans, it learnt to assess responses (from whether they were accurately giving an email address, to whether their tone was happy or angry), which would then allow it to progress through its flowchart of options to respond.
An important element was providing the chatbot with a number of different responses to the same human input, to avoid it sounding too scripted and, er, robotic.
This was definitely a useful introduction, but I’m guessing there’s a lot more to learn.
Pandas
Marc Garcia, one of the core developers of pandas, ran a super interesting and well-explained session on the popular Python library. I’ve used pandas before, but in a fairly self-taught, fingers-crossed kind of way, so a big benefit here was confirming that I was actually pretty on top of things.
Looking back, I’m surprised by how much of that uses Python! One of my current goals is to become more comfortable using Python, so I’m pleased to see that, although at the moment I’m still loving R.